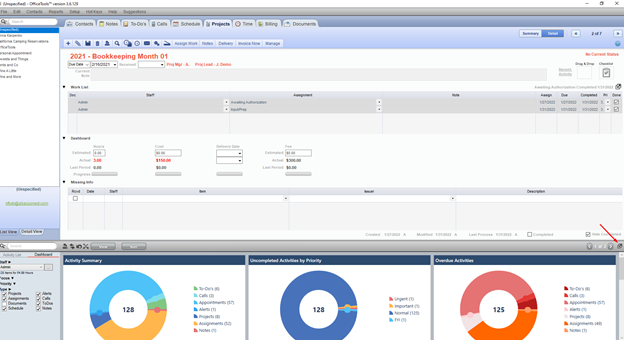
With a new dashboard attached to the Activity list, we've provided even more options to view your teams work and productivity.
What does it do?
The tiles are summarizing the events that are on your activity list. We have also included tiles for data that are not on the activity list like time cards totals and a list of completed events.
How to access the dashboard
Utilize the Toggle to navigate between the activity list and dashboard view. 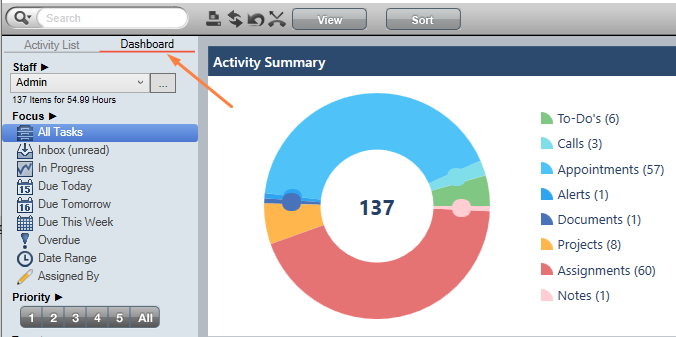
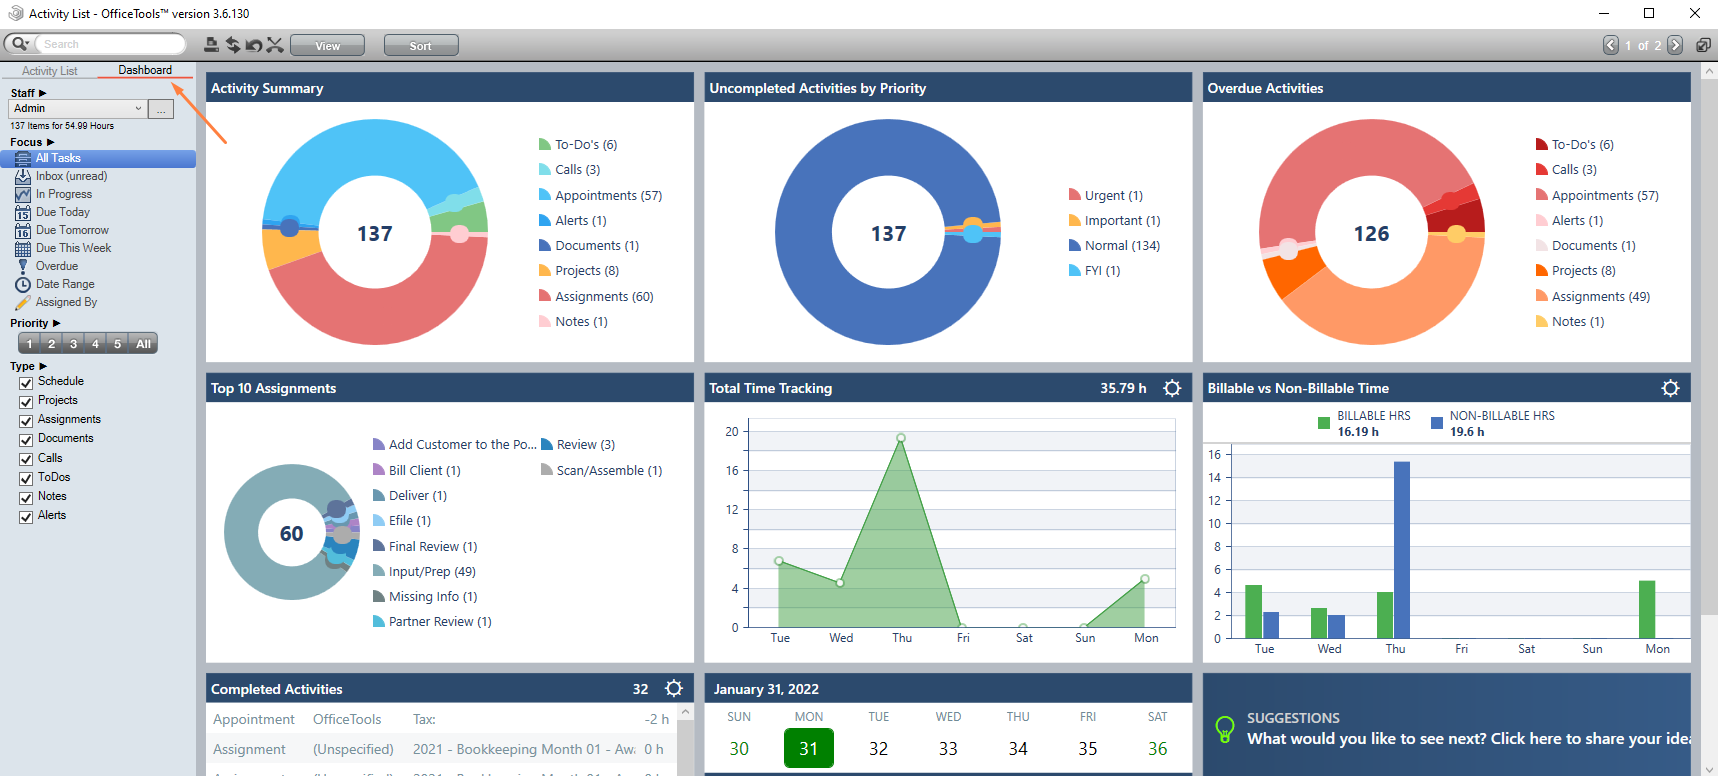
How we are visualizing your Team Dashboard list
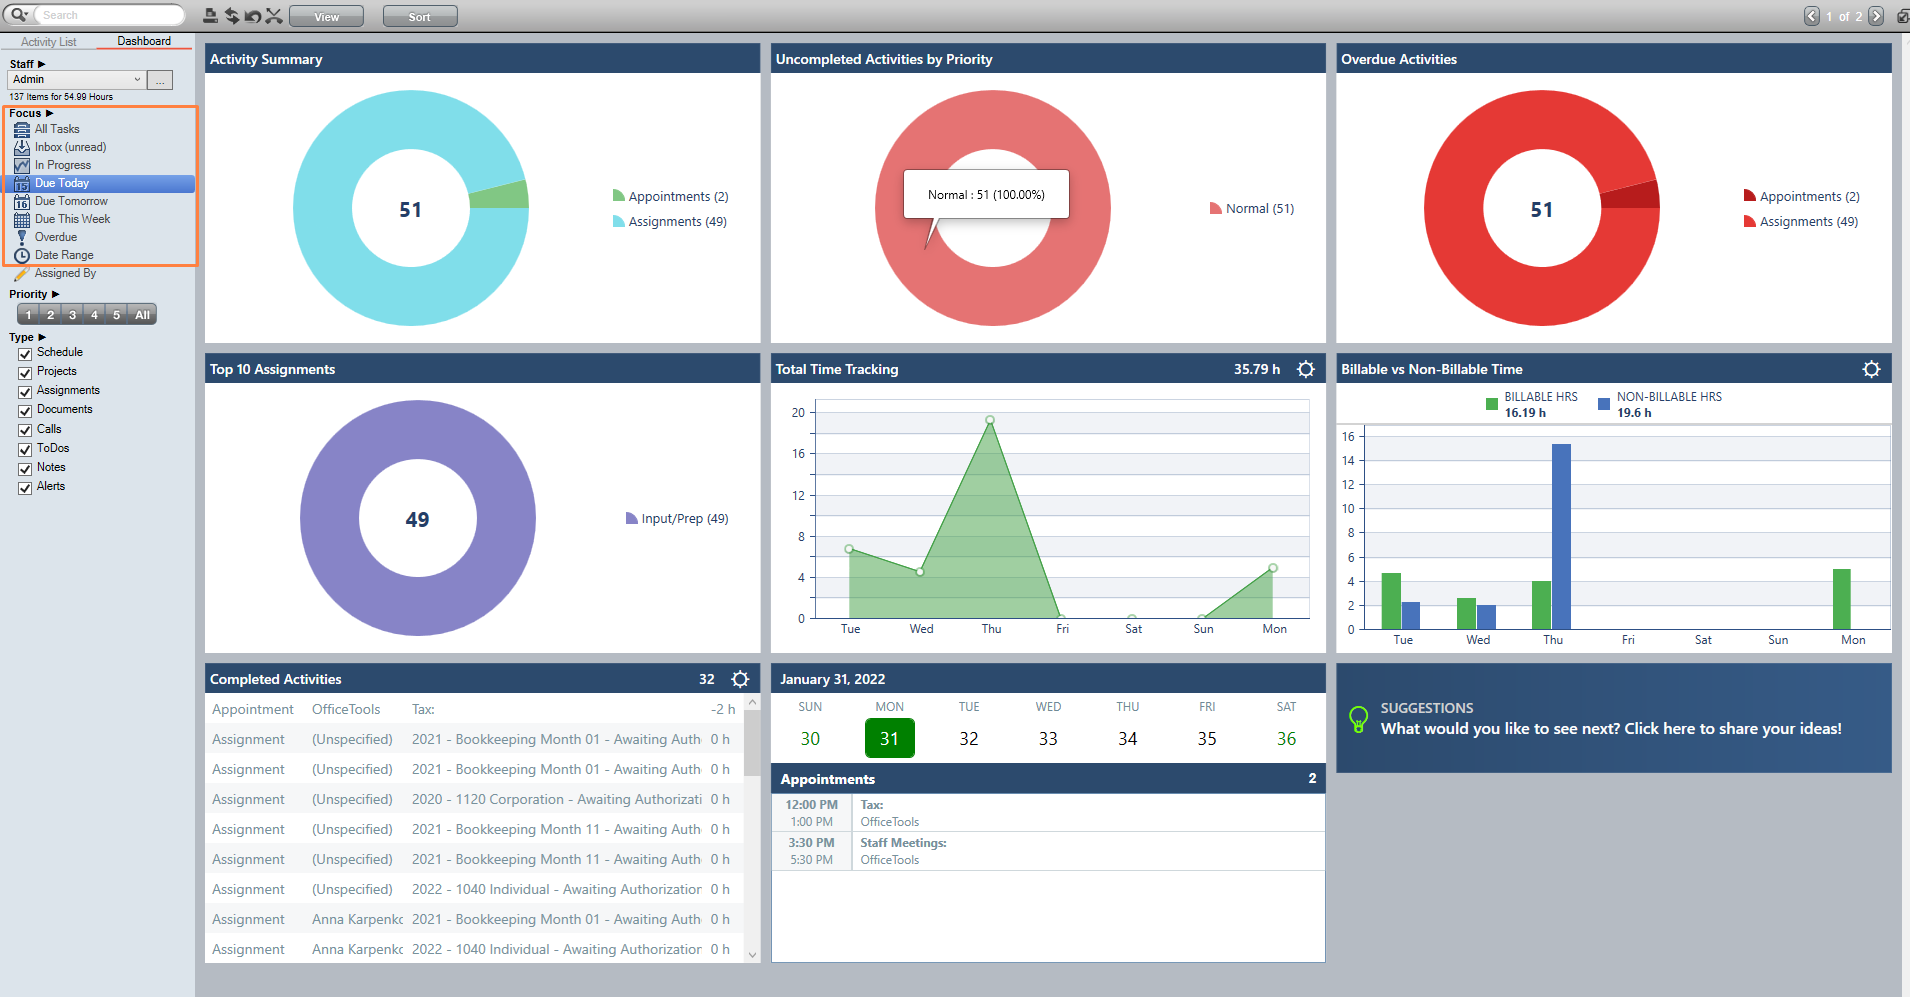
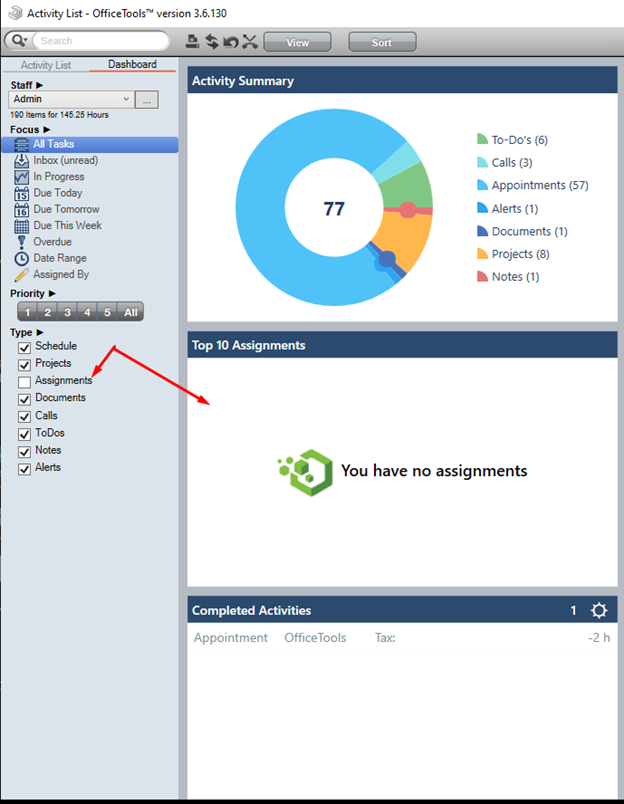
The tiles are summarizing the events that are on your activity list. The focus feature controls the data that is being included/excluded on the activity list and the dashboard.
Change the focus option to filter to show the items that are important to you. (This filter will not apply to the time and complete activities tiles.)
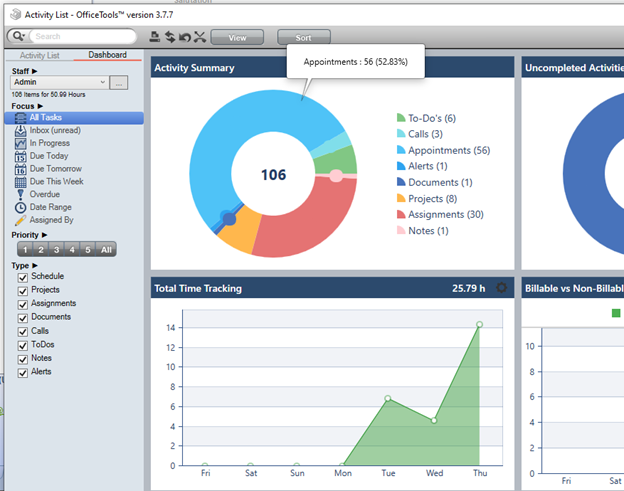
Hover metrics
Hover over a the chart or the Legend to get a percentage breakdown of the activity that is on your activity list.
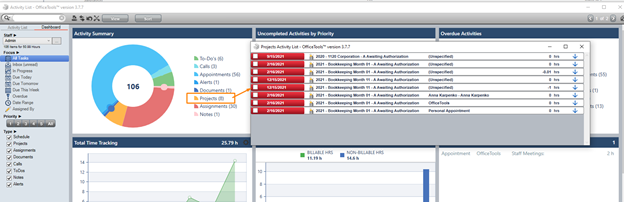
On-Click
When clicking on the legend or pie graph the activity list will open and filter to the specific items for a efficient way to get to the most important details.
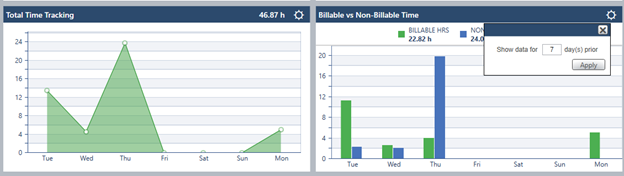
Settings
Utilize the gear on the tile to change the range of day(s) you wish to see. (This is only available on the time and complete event tiles.)
Filters and Data
When filters or sorts are in place it may filter out all available data for the tile.
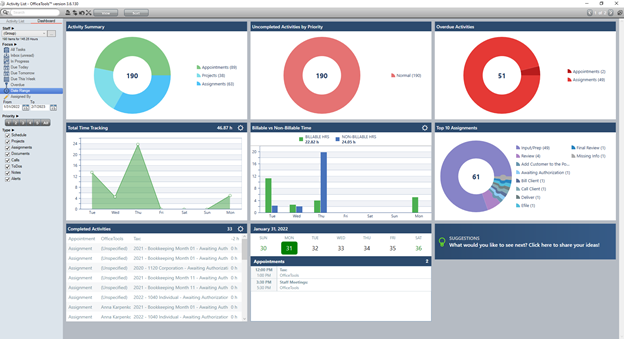
Undocking
Undock the Dashboard for a full screen experience. Watch the tiles update as activity is added and completed.
How to undock the activity list
Comments
0 comments
Article is closed for comments.